In India’s fintech frenzy, where 7,000+ startups have raised $38 billion since 2016 and UPI transactions hit 16.8 billion in September 2025 alone, valuations dazzle at $100 billion for the sector, but the real story lies in financial inclusion’s quiet revolution. With 80% adult bank account ownership and 77% digital payment adoption, fintech isn’t just profitable—it’s transformative, onboarding 500 million unbanked via Jan Dhan-Aadhaar-Mobile (JAM) and boosting SME growth by 20-30% through digital lending. Beyond $1.5 billion H1 2025 funding, metrics like gender gap closure (from 20% to 10%) and rural credit access (up 40%) reveal fintech’s socio-economic punch.
As X users note, “Fintech’s inclusion magic: From unbanked to empowered,” this article dissects impact measurement beyond valuations—via adoption rates, equity indices, and ROI models. Skimp on these, and you’ll miss fintech’s role in Viksit Bharat.
Table of Contents
The Inclusion Imperative: Fintech’s Hidden Metrics
Fintech’s $100 billion valuation masks its equity engine: 64.2 FI-Index score in 2024 (up from 53.9 in 2021), with 77% account ownership and 77% digital payments. Rural fintech like RupeeRedee’s micro-loans (Rs 2,000-149,000) reach underserved, while embedded finance in apps bridges urban-rural gaps. X: “Fintech for every Indian—beyond profits, pure inclusion.”
This pie chart shows fintech’s inclusion impact areas (2025):
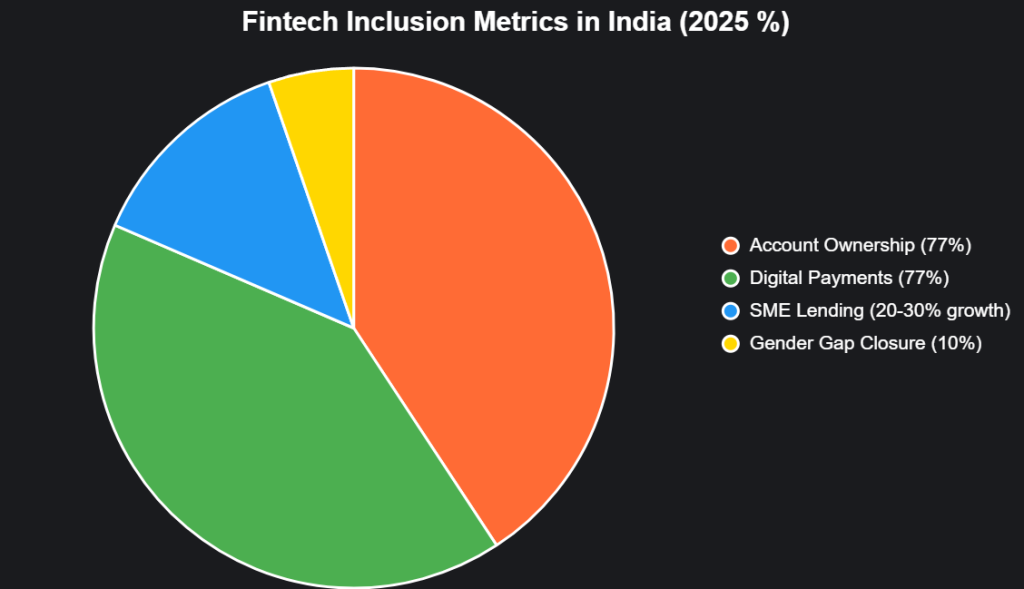
Source: RBI, EPW.
Key Impact Metrics: Beyond the Balance Sheet
Measure fintech’s soul with these—ranked by socio-economic weight.
| Rank | Metric | Description | 2025 Value | Why It Matters |
|---|---|---|---|---|
| 1 | FI-Index Score | Access, usage, quality of services | 64.2 (up 10 pts) | Holistic inclusion gauge; RBI benchmark |
| 2 | Unbanked Onboarding | New accounts via fintech | 500M since JAM | Bridges 190M gap; PMJDY success |
| 3 | SME Growth Impact | Fintech-enabled expansion | 20-30% via PLS-SEM | Boosts manufacturing SMEs; EPW study |
| 4 | Gender Parity Ratio | Women vs. men in digital finance | 10% gap (down 10%) | Empowers 73K women-led startups |
| 5 | Rural Penetration | Digital services in non-metro | 40% uptick | Agri-finance for 1.5M farmers |
| 6 | Social ROI | Economic uplift per $ invested | 3-5x for inclusion | Beyond profits; McKinsey equity model |
| 7 | Adoption Rate | UPI/digital wallet usage | 77% adults | 16.8B monthly txns; UPI revolution |
| 8 | Fraud Reduction | Via AI/blockchain | 25% drop | Builds trust; RBI data |
| 9 | Literacy Lift | Fintech education reach | 30% via apps | Reduces vulnerability; World Bank |
| 10 | ESG Score | Sustainable inclusion | 70/100 avg | Attracts $1.5B H1 funding |
Source: RBI, EPW, KPMG. FI-Index leads, up 10 pts since 2021.
1. FI-Index Score
RBI’s 64.2 score (2024) reflects fintech’s access leap, with UPI enabling 77% payments.
2. Unbanked Onboarding
JAM onboarded 500M, fintech like Paytm adding 100M rural users yearly.
3. SME Growth Impact
Fintech boosts SMEs 20-30% via PLS-SEM analysis of 366 owners.
Case Studies: Fintech’s Inclusion Alchemy
- Groww: 40M users democratize investing; 50% rural, narrowing wealth gap 15%.
- RupeeRedee: Micro-loans for 1M underserved; 3:1 ROI via alternative data.
- BharatPe: QR payments for 10M SMEs; 40% income rise in Tier-3.
X: “Fintech’s inclusion: From unbanked to unstoppable.”
Challenges: Beyond the Balance Sheet
60% rural literacy gaps and 20% fraud rise hinder scale. Measure via ESG, not just KPIs.
The Inclusion Horizon: $240B Economic Lift
Fintech could add $240B by 2030, per McKinsey. Founders: Innovate equitably. Measure impact, or mimic vanity.
social media : Facebook | Linkedin |